‘Via, Veritas, Vita’, University of Glasgow’s Latin motto translates as ‘the Way, the Truth, the Life’. It was a fitting crest in the lecture theatre, above the head of Prof John Curtice, political analyst and Polls pundit for BBC, as he gave this lecture five days after the United Kingdom voted to leave the European Union. The polls act as an indicator of the way people vote. Curtice’s analysis of their findings aim to give an understanding or truth on key beliefs that made people vote and, as such, captured the divisions of contemporary life in the UK. For further information Curtice’s blog can be found at here. This post represents my lecture notes of the statistics and Curtice’s interpretation.
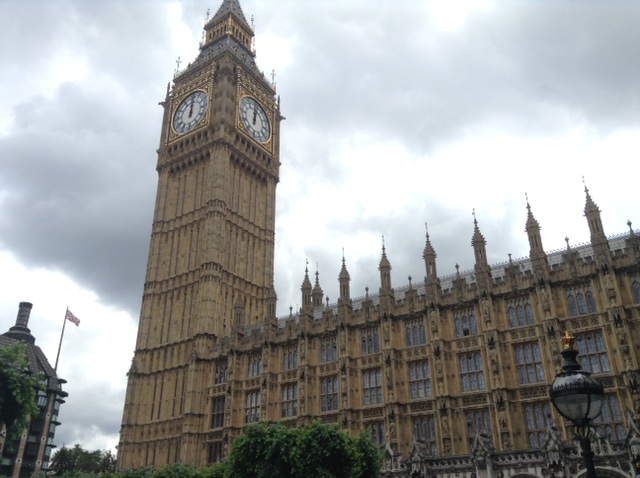
Houses of Parliament, London, 27.6.16 Photo: Jenny Brownrigg
‘The Partisan Fallout’, % who voted Leave: UKIP: 96%; Conservative: 58%; Labour: 37%; SNP: 36%; Lib: 30%
Curtice stated that from looking at the percentage of ‘Partisan Fallout‘ it was not Jeremy Corbyn who lost the EU Referendum but David Cameron, by failing to take his party with him. Curtice placed this loss firmly at 19 Feb 2016, when Cameron came back from renegotiation with EU. Given the figure therefore of Corbyn taking 63% with the Labour Party line, Curtice assessed that the EU Referendum was a pretext for Labour to attempt to get rid of their leader. Curtice said from the above figures that UKIP was only party to take the majority of their members with them. Intriguingly SNP did not carry all their party members with them. Curtice stated that when future politics students review the first twenty years of this century, they will see that Nigel Farage was a key player, on the terms that he was the only politician to achieve the aims of his party’s manifesto.
In the polls regarding ‘Credibility of Main Argument’, only 17% thought it a true statement with ‘Remain‘ strapline that we would each be £4300 worse off. 70% believed it false. 47% felt it a true statement that ‘Leave‘ made that we send £350 million to EU, 39% false.
‘The Role of English Identity’:
This poll question on identity asked how voters – did they identify fully with an English identity or did they define themselves primarily as British? 79% strongly identified as English; 66% agreed with the statement that they were equally English and British; and 40% identified primarily as British. Curtice mentioned that Britishness has been sold as a multicultural identity, eg British Muslim, where as Englishness is a nationalist identifier. He pointed out that English and Scottish nationalists voted differently in the Referendum; with the former voting for ‘Leave‘ and the latter for ‘Remain‘.
Curtice went on to say that 53% White voted to ‘Leave‘ in comparison to 32% BAME.
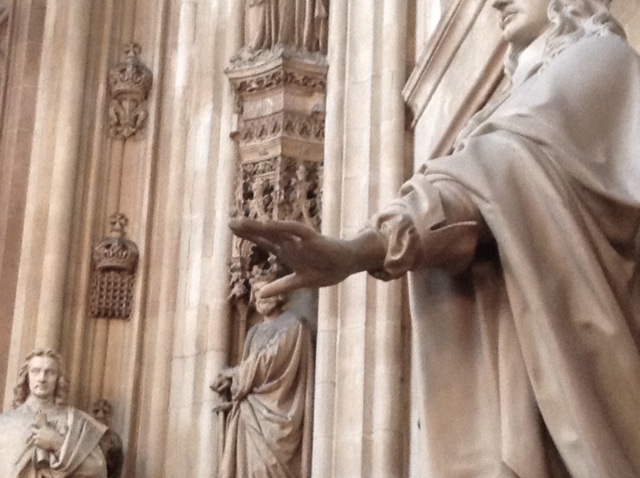
Interior, Houses of Parliament 27.6.16 Photo: Jenny Brownrigg
He stated that ‘Education‘ was a key factor in vote, with 70% studying to GSCE level only, voting to ‘Leave‘ whilst 32% studying to Degree level voted ‘Leave‘. Looking at other education categories the % vote to ‘Leave’ was: 50% A Level; 52% other Higher. There was a difference in perception of ‘The Economic Consequences of Brexit‘: 14% of Degree educated thought the economic situation would be better if UK left EU, whilst 54% of Degree educated through it would be worse. 30% of those educated to GSCE or less thought the economic situation would be better following Brexit; whilst 24% of GSCE level or less thought the economic situation would be worse.
Age also was a key factor, with 27% of 18-24 voting ‘Leave‘ and 60% 65+ voting ‘Leave‘. This was one of the biggest social divisions.
There were also, linked to age and education, different views on EU migration. People were asked if the % of EU migration was currently too high. 46% of 18-24 vs 84% 65+ agreed with the statement; whilst 54% educated to Degree level vs 81% to GSCE level or less agreed with the statement. Curtice described this finding as clearly illustrating for the majority of 65+ or the majority of those educated to GSCE level only, that ‘this globalised world is not one where the riches are falling on them’. Curtice showed statistics of ‘The Graduate Distribution’, showing the volume of graduates geographically in UK, with included in the range, the highest of 39% in London, 25% in Scotland down to 22% in North East.

Interior, Houses of Parliament 27.6.16 Photo: Jenny Brownrigg
Next was ‘Perceived Consequences’, and the % that thought if they voted Leave that each factor would be better:
Control Laws: 78% thought leaving EU it would be better, hence the success of the ‘Leave‘ Campaign’s key message ‘Take Back Control‘. Immigration:70%; Fair Welfare: 57%; Terrorism:50%; Jobs:49%; Economy:47%; Influence:46%; International Investment:40%
Curtice said therefore that the ‘Remain‘ campaign’s key message of ‘Economy‘, with only 47% was therefore not as effective as the principal card of the ‘Leave‘ campaign on ‘Immigration’ at 70%.
‘Why Leave?’: 49% Sovereignty; 33% Immigration; 13% Integration; 6% Economy.
‘Problems and Solutions’:
Economy ‘Remain‘: 19% believed the statement that the economy would be better to ‘Remain‘ whilst 24% thought it would get worse. Economy ‘Leave‘: 22% thought it would be better for economy if UK left, whilst 45% thought it worse. Immigration ‘Remain‘: 5% believed immigration would be better if UK voted ‘Remain‘, whilst 52% believed it would be worse. Immigration ‘Leave‘: 49% felt immigration would be better if UK voted ‘Leave‘, whilst 8% believed immigration would be worse.
Curtice commented that the new dividing lines from this EU Referendum could be stated as ‘Social Liberals‘ and ‘Social Conservatives‘, rather than previous markers of ‘Left‘ and ‘Right’. The younger voter for example, was mostly educated to higher level and was of the opinion that, on immigration “We all rub along together”. The older voter was of the opinion that, “…this was not the country we were born into”. He also described the difference between those who had taken advantage of globalisation and those who were deeply socially uncomfortable with globalisation. There was economic division with who could take advantage of social mobility. A further division was those who enjoyed sharing diverse languages and cultures and were able to experience ‘a common culture together’; and those who experienced a diversity of “language as isolating and cultural change as a challenge”.
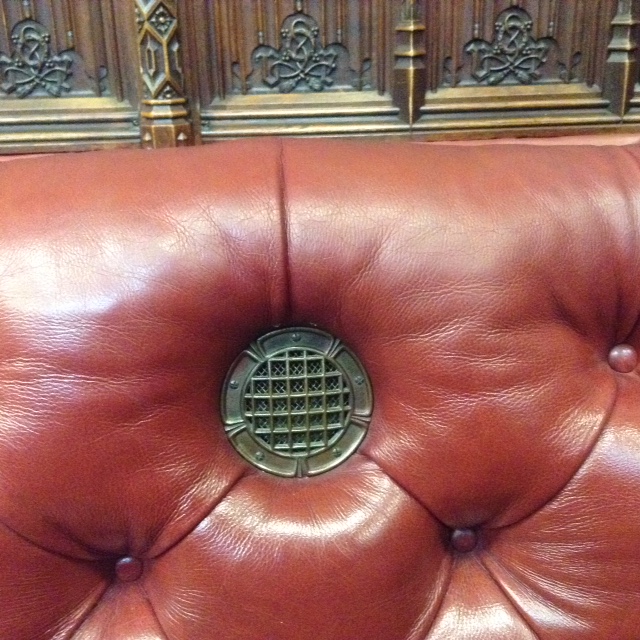
Interior, House of Lords, 27.6.16 Photo: Jenny Brownrigg
Curtice’s conclusions were:
- Social division indicated winners and losers of globalisation
- Social Liberalism versus Social Conservatism cut across most party support
- David Cameron did not return with enough from Feb 2016 EU Summit and his re-negotiation of terms, so failed to take 58% of his party with him
- ‘Remain‘ had little more to offer than a message about ‘Economics‘ being worse off. This message, to avoid economic perils, was a message not believed by voters.
- ‘Leave‘ offered a more believed solution with clearer strapline on taking control of laws.
- Role of ‘English Identity’ also a big factor.
In analysing the Polls, Curtice thought Labour has to find a different message from trying to convince members that they can still ride the benefits of Capitalism to re-distribute to all or those worse off- many Labour members felt left behind. Also conversely with international capitalism, where jobs are created people would follow, which is demonstrated by free movement, which again was proving problematic.
In Scotland, polls asked the hypothetical question ‘How would you vote now?‘ Following the EU Referendum. In the Independence Referendum the result was 47% YES- 53% NO. In this new poll 52% YES – 48% NO. There was a modest increase in support for Scottish Independence of 4-5% increase in favour. Curtice felt that this percentage was not high enough for SNP to go quickly for IndyRef2, as whilst there had been a swing following EU vote, it was no way near the 60% SNP are looking for in favour of ‘Yes‘ to Independence.
